Cache Conscious Hash Maps
Here’s a link to the code on GitHub
I’ve been trying to understand profiling and performance tooling better, and there didn’t seem to be a better way than to try to write a cache aware hash map.
The hard part here is getting familiar with the tooling and semantics of tools on different platforms (hint: avoid OSX)
Setting Up The Tooling
My only recommendation in this section is to avoid using any platform other than Linux for profiling. perf is a godsend, and Apple is a locked down nightmare of an OS. The closest thing to perf on OSX is dtrace but you need to disable System Integrity Protection (SIP) on Mac for that. This is a very involved process that involves rebooting your Mac. Even then, I don’t think you get access to hardware counters on Mac.
Contrast this with Linux, where I managed to capture all the requirements to get up and running with all profiling metrics in this GitHub issue. Additionally, there is great documentation for both strace and perf on Linux whereas documentation for Instruments is inadequate on OSX.
I purchased a refurbished Dell laptop and installed Ubuntu on it.
Building A HashMap
Let’s dig into building the hashmap itself now. Everyone is familiar with the external API surface of a hashmap - 4 methods. There’s a few things we need to track internally too.
struct HashMap {
  data: Vec<T>  //  not specifying what T is here
  size: usize,
  capacity: usize
}

pub fn new(capacity: usize) -> Self
pub fn get(key: K) -> Result<Option<V>>
pub fn insert(key: K, value: V) -> Result<()>
pub fn delete(key: K) -> Result<()>
fn get_load_factor() -> f64
fn resize() -> Result<()>
The load factor determines when the hash map needs to be resized. I’m setting it to 0.7 for all the examples here.
Building a hash map itself isn’t too hard, it’s figuring out how to handle collisions that’s challenging. There’s broadly 2 ways to do this:
- chaining
- open addressing
Chaining
The chained hash map is the most intuitive way to think about handling collisions - convert each entry into a linked list.
Now, you can append onto each entry any time you encounter the same index.
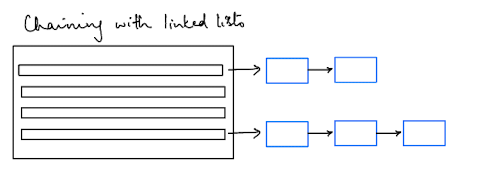
For chaining, the hashmap struct would look something like this
struct Node<K, V> {
  key: K,
  value: V,
  next: Option<Box<Node<K, V>>>
}

struct LinkedList<K,V> {
  head: Option<Box<Node<K, V>>>
}

struct HashMap<K, V> {
  data: Vec<LinkedList<K, V>>,
  size: usize,
  capacity: usize
}
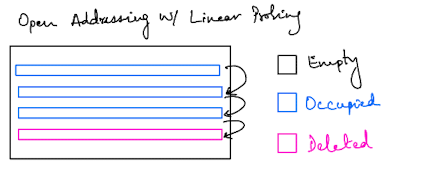
Open Addressing
The open addressing hash map, instead, tries to find the next empty slot in the vector. There’s a couple of different variations here:
We’ll use linear probing in this example to keep things simple. The important thing to note is that with open addressing we expect better cache performance, and therefore better overall performance. If you want a detailed explanation of this, look at this SO answer. The tl;dr is that following the pointers in a linked list leads to cache trashing since the nodes are not “clustered” together in memory.
For open addressing the hash map struct would look something like this
enum Entry<K, V> {
  Empty,
  Deleted(K),
  Occupied(K, V)
}

struct HashMap<K, V> {
  data: Vec<Entry<K, V>>,
  size: usize,
  capacity: usize,
}
Cache Hardware
Now, let’s try and understand why we expect better performance from our open addressing implementation vs chaining implementation.
CPU caches come in 3 flavours - L1, L2 and a shared L3 cache. L3 connects out to RAM.

A CPU will first check its L1 cache for some data. Upon failing to find it in L1, it will search L2, then L3 and eventually RAM.
We want the CPU to stay as far up this hierarchy as possible because each cache miss means an extra fetch which wastes cycles.
Each cache has a unit called cache lines - these are the actual storage units. For instance, an L1 cache of size 128 KB with a 64 byte cache line, has 2,048 cache lines. We want our data to fit in these cache lines to prevent additional fetches.
Now, when the program first loads and a cache miss is encountered, the load will reach RAM and attempt to read the data. However, when the memory is read, the principle of spatial locality is followed and some surrounding memory is read as well.
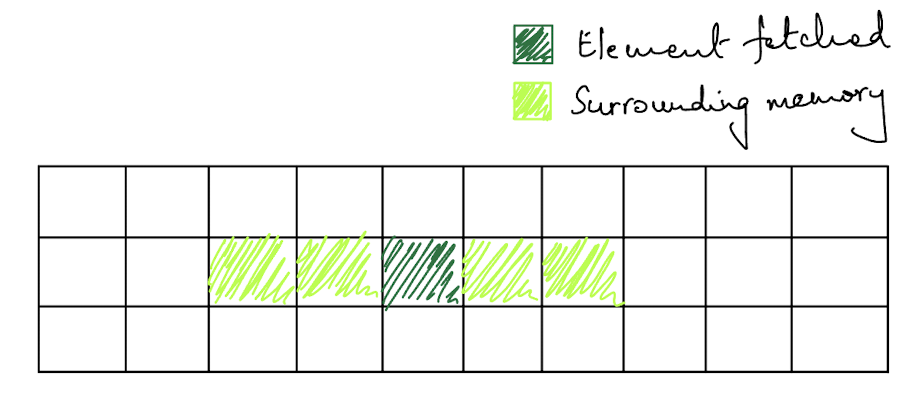
If we are storing our data in a Vec with as few memory hops as possible, this is great because it is unlikely we’ll encounter a cache miss soon. However, if our data structure has a fragmented memory approach, like in Vec<LinkedLinked<T>>, then it is more likely we’ll end up encountering a cache miss again in the near future.
So, what we should expect to see is that the cache performance of the open addressing approach is better than the chaining approach.
Cache Performance
Let’s run our actual program and collect some performance metrics. I wrote some basic benchmarks and a test harness that you can see here and here.
Below are the cache counter stats, followed by CPU stats. For the cache stats, think of the first 2 lines as showing a rough aggregate. The LLC below stands for last level cache which is the L3 cache.
  Performance counter stats for './target/release/hashmap -w load_factor -i chaining':

       762,544,185      cache-references                                                        (66.66%)
       597,421,905      cache-misses                     #   78.35% of all cache refs           (66.66%)
     8,145,732,959      L1-dcache-loads                                                         (66.67%)
       279,075,767      L1-dcache-load-misses            #    3.43% of all L1-dcache accesses   (66.68%)
       144,218,848      LLC-loads                                                               (66.67%)
       106,241,540      LLC-load-misses                  #   73.67% of all LL-cache accesses    (66.66%)

      14.427876578 seconds time elapsed

      13.234905000 seconds user
       1.191811000 seconds sys

  Performance counter stats for './target/release/hashmap -w load_factor -i open_addressing':

       654,770,201      cache-references                                                        (66.67%)
       509,578,087      cache-misses                     #   77.83% of all cache refs           (66.68%)
     5,511,667,961      L1-dcache-loads                                                         (66.67%)
       272,838,534      L1-dcache-load-misses            #    4.95% of all L1-dcache accesses   (66.67%)
        91,460,491      LLC-loads                                                               (66.66%)
        59,470,563      LLC-load-misses                  #   65.02% of all LL-cache accesses    (66.65%)

       9.068350211 seconds time elapsed

       7.816879000 seconds user
       1.250820000 seconds sys
  Performance counter stats for './target/release/hashmap -w load_factor -i chaining':

                61      context-switches                 #    4.226 /sec
                 0      cpu-migrations                   #    0.000 /sec
    33,334,941,421      cycles                           #    2.309 GHz
    34,737,785,689      instructions                     #    1.04  insn per cycle
     6,377,780,492      branches                         #  441.853 M/sec
        37,015,167      branch-misses                    #    0.58% of all branches
         14,434.16 msec cpu-clock                        #    1.000 CPUs utilized
         14,434.20 msec task-clock                       #    1.000 CPUs utilized

      14.436026853 seconds time elapsed

      13.282750000 seconds user
       1.151891000 seconds sys

  Performance counter stats for './target/release/hashmap -w load_factor -i open_addressing':

                24      context-switches                 #    2.635 /sec
                 1      cpu-migrations                   #    0.110 /sec
    24,113,035,970      cycles                           #    2.647 GHz
    26,051,667,680      instructions                     #    1.08  insn per cycle
     4,472,654,897      branches                         #  491.004 M/sec
        30,880,291      branch-misses                    #    0.69% of all branches
          9,109.20 msec cpu-clock                        #    1.000 CPUs utilized
          9,109.21 msec task-clock                       #    1.000 CPUs utilized

       9.110056061 seconds time elapsed

       7.864538000 seconds user
       1.244926000 seconds sys
You can find a summary of the important metrics in the table below
| Metric | Chaining | Open Addressing |
|---|---|---|
| Cache Miss Rate | 78.35% | 77.83% |
| L1-DCache Miss Rate | 3.43% | 4.95% |
| LLC Cache Miss Rate | 73.67% | 65.02% |
| Execution Time (seconds) | 14.43 | 9.07 |
| Instructions | 34,737,785,689 | 26,051,667,680 |
The results are surprising to say the least. Open addressing performs better overall as expected, but not for the reasons we expected. We expected better cache performance from open addressing but don’t see that at all.
In fact, the majority of the gains come from having to execute fewer instructions for open addressing. There’s no walking the chain and loading each node from memory in open addressing.
But, why is the cache performance so poor in open addressing? In fact, the cache performance of open addressing is actually worse at the L1 level than chaining and only slightly better at the L3 cache level.
To figure out why we are getting such poor cache performance, we need to understand the memory layout of our data structures and the size of our cache. This will help us figure out how many elements can be placed in a single cache line.
Cache Sizing
Figuring out the size of the cache on Linux is straightforward. You run lscpu | grep "cache" and it gives you the information
zaid-humayun@zaid-humayun-XPS-13-9370:~$ lscpu | grep "cache"
L1d cache:                            128 KiB (4 instances)
L1i cache:                            128 KiB (4 instances)
L2 cache:                             1 MiB (4 instances)
L3 cache:                             8 MiB (1 instance)
This tells me that I have 4 cores, each with an L1 cache (128KiB) and an L2 cache (1MiB) and finally one shared L3 cache (8MiB).
Next, we need to figure out the size of the cache line and it’s easy to do that with cat /proc/cpuinfo | grep "cache_alignment" which shows 64 bytes. So, we have 2,048 cache lines, since 64 bytes * 2048 = 128KiB
Memory Layout
Now, this is where the real meat of the problem is since this is what we control. Let’s look back at our data structures we were using again.
Before we get into this, a quick reminder that a String in Rust is represented by 24 bytes (8 for the heap pointer, 8 for the size & 8 for the capacity).
For chaining, we are using a linked list to store the data. We can figure out the size of the LinkedList struct using std::mem::size_of::<LinkedList>() and when K and V are of type String, this turns out to be 8 bytes. With a cache line of 64 bytes, we can fit 8 entries per cache line. Here, LinkedList itself is an Option<Box<Node<K, V>>>
Option<T> typically takes an extra byte for it's discriminant so the overall size should be 16 bytes including padding (8 + 1).
This is because of the Rust compiler's null pointer optimization, which is suprisingly hard to find a resource for. In our case, the type
LinkedList is an Option<Box<T>> and Box<T> is a non-nullable type, so Option<Box<T>> is the same size as Box<T>
Here’s a visualisation of how that is being laid out in the cache.
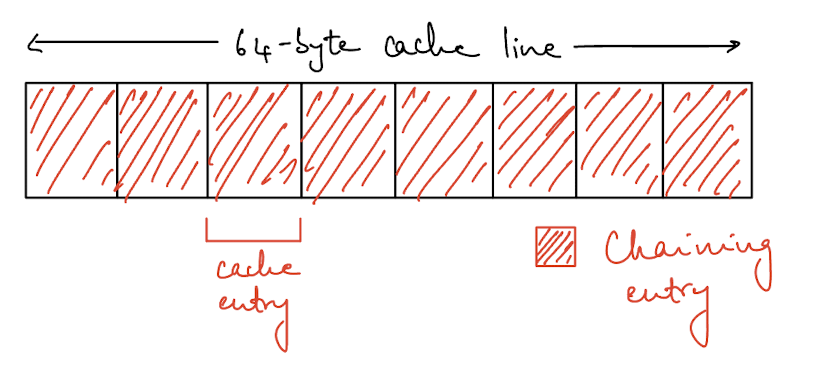
This is good in terms of layout but each entry ends up being a pointer into the heap, so that’s not great because that means we always end up doing an extra fetch for each entry.
For open addressing, we are using an Enum where the memory layout is 48 bytes when K and V are of type String. It’s 48 bytes because the largest variant is a tuple of String and each String type is 24 bytes.
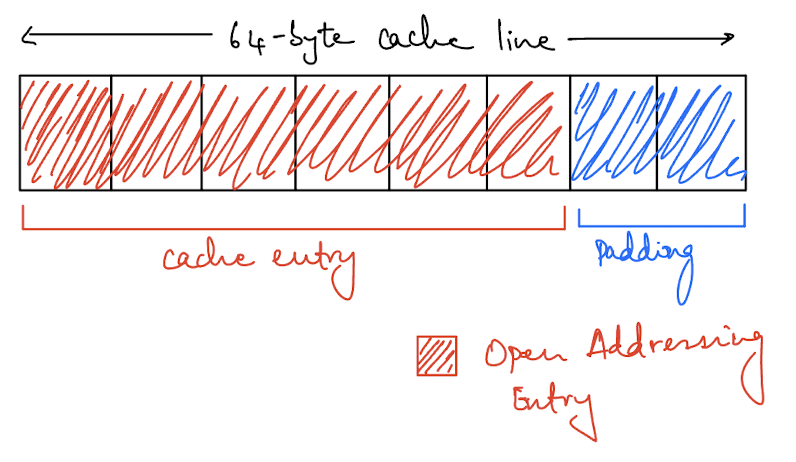
Once we have padding alignment, we can only fit 1 element of our open addressing variant per cache line. This is significantly worse than the chaining layout but each entry here isn’t a pointer into heap memory (well, it is because the type is a String but we’ll get to that).
In fact, since we can fit 8 entries per cache line with the chaining approach, we see a slightly better performance in the L1 cache there (3.53% vs 4.95%). However, you can see the cost of pointer chasing with the total number of loads in the L1 cache (8.1B vs 5.5B). Even though chaining is more compact and cache efficient, the overall cost of pointer chasing ends up dominating the whole operation and open addressing performs better.
Types And Pointer Chasing
So, we know that memory layout of our data structures can have a major performance impact, but so could the actual types we use in the hash map.
Strings inherently require pointer chasing. Regardless of how efficient we are with our memory layout for our struct, having a String in the key and value significantly impacts the cache performance.
However, if we replace the key-value pairs with u64 then for open addressing each entry only takes 24 bytes now instead of 48, which means 2 entries per cache line instead of 1. So, I tried running the same profiling with u64 key-value pairs.
Performance counter stats for './target/release/hashmap -w load_factor -i chaining':

       372,807,778      cache-references                                                        (66.65%)
       252,436,979      cache-misses                     #   67.71% of all cache refs           (66.65%)
     2,380,114,906      L1-dcache-loads                                                         (66.67%)
       140,770,087      L1-dcache-load-misses            #    5.91% of all L1-dcache accesses   (66.69%)
        72,878,214      LLC-loads                                                               (66.68%)
        41,523,145      LLC-load-misses                  #   56.98% of all LL-cache accesses    (66.66%)

       6.273809754 seconds time elapsed

       5.943481000 seconds user
       0.330026000 seconds sys

 Performance counter stats for './target/release/hashmap -w load_factor -i open_addressing':

       217,178,237      cache-references                                                        (66.63%)
       167,946,747      cache-misses                     #   77.33% of all cache refs           (66.64%)
       880,710,536      L1-dcache-loads                                                         (66.68%)
        81,384,415      L1-dcache-load-misses            #    9.24% of all L1-dcache accesses   (66.71%)
        23,916,052      LLC-loads                                                               (66.70%)
        14,262,560      LLC-load-misses                  #   59.64% of all LL-cache accesses    (66.65%)

       2.421592557 seconds time elapsed

       2.128437000 seconds user
       0.293060000 seconds sys
Overall performance is considerably better, which validates our theory about u64 being better for cache performance but we still need to improve on our cache performance with open addressing.
Entry<String, String> above, I needed 48 bytes whch is just the size of the two String pointers.
However, when I had
Entry<u64, u64>, the size of the entry was 24 bytes (and not just 16 bytes which is the size of two u64). What gives?
The Rust compiler is doing something called niche optimization to reduce the size of the memory layout. Since, the
String is backed by a non-nullable type in Vec, the compiler can use that to represent the null case. It can't do the same for u64 since 0 is actually a valid value there.
Compact Memory Layout
Let’s design a more compact memory layout, something that will fit more easily into our cache. We’ll call this our open addressing compact variation, since it builds on top of open addressing.
We can try splitting up the state (whether the entry is free, occupied or tombstoned) and the actual data into separate vectors.
pub struct HashMap<K, V>
where
    K: Key,
    V: Value,
{
    status_bits: Vec<u8>,
    entries: Vec<(K, V)>,
    capacity: usize,
    size: usize,
}
Now, when we have K and V as u64, each entry in the entries vector will be a tuple of size 16 bytes, which means 4 of them should fit in one cache line. To denote whether an entry is occupied, deleted or empty we’ll use 2 bits from the status_bits vector for each entry.
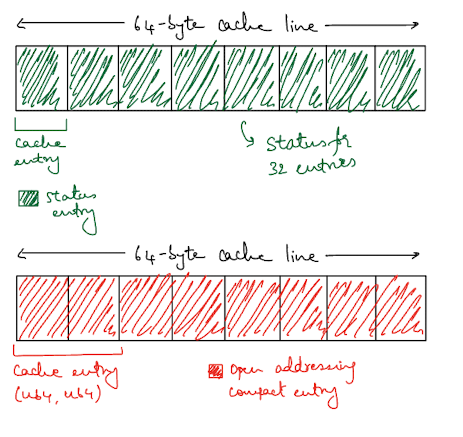
This means that we have to load two separate vectors into our cache but we still end up being more efficient. Each byte in the status_bits vector can hold the status of 4 entries, so a single entry of 8 bytes in the cache can hold the status of 32 entries.
Here’s some code that shows the indexing scheme. If you’re interesting in seeing the code in full context, look here.
// 2 bits per entry: 00 = empty, 01 = deleted, 11 = occupied
const EMPTY: u8 = 0b00;
const DELETED: u8 = 0b01;
const OCCUPIED: u8 = 0b11;

fn get_status(&self, index: usize) -> u8 {
    let byte_idx = index / 4;
    let bit_offset = (index % 4) * 2;
    (self.status_bits[byte_idx] >> bit_offset) & 0b11
}

fn set_status(&mut self, index: usize, status: u8) {
    let byte_idx = index / 4;
    let bit_offset = (index % 4) * 2;
    // Clear the two bits
    self.status_bits[byte_idx] &= !(0b11 << bit_offset);
    // Set the new status
    self.status_bits[byte_idx] |= (status & 0b11) << bit_offset;
}
Now, let’s try running our profiling again and see how we fare.
Performance counter stats for './target/release/hashmap -w load_factor -i chaining':

       372,807,778      cache-references                                                        (66.65%)
       252,436,979      cache-misses                     #   67.71% of all cache refs           (66.65%)
     2,380,114,906      L1-dcache-loads                                                         (66.67%)
       140,770,087      L1-dcache-load-misses            #    5.91% of all L1-dcache accesses   (66.69%)
        72,878,214      LLC-loads                                                               (66.68%)
        41,523,145      LLC-load-misses                  #   56.98% of all LL-cache accesses    (66.66%)

       6.273809754 seconds time elapsed

       5.943481000 seconds user
       0.330026000 seconds sys

 Performance counter stats for './target/release/hashmap -w load_factor -i open_addressing':

       217,178,237      cache-references                                                        (66.63%)
       167,946,747      cache-misses                     #   77.33% of all cache refs           (66.64%)
       880,710,536      L1-dcache-loads                                                         (66.68%)
        81,384,415      L1-dcache-load-misses            #    9.24% of all L1-dcache accesses   (66.71%)
        23,916,052      LLC-loads                                                               (66.70%)
        14,262,560      LLC-load-misses                  #   59.64% of all LL-cache accesses    (66.65%)

       2.421592557 seconds time elapsed

       2.128437000 seconds user
       0.293060000 seconds sys

 Performance counter stats for './target/release/hashmap -w load_factor -i open_addressing_compact':

       171,399,933      cache-references                                                        (66.61%)
        86,106,253      cache-misses                     #   50.24% of all cache refs           (66.61%)
       955,677,380      L1-dcache-loads                                                         (66.66%)
        64,703,719      L1-dcache-load-misses            #    6.77% of all L1-dcache accesses   (66.73%)
        24,137,327      LLC-loads                                                               (66.73%)
         6,734,891      LLC-load-misses                  #   27.90% of all LL-cache accesses    (66.66%)

       1.617498666 seconds time elapsed

       1.411503000 seconds user
       0.205927000 seconds sys
| Metric | Chaining | Open Addressing | Open Addressing Compact |
|---|---|---|---|
| Cache Miss Rate | 67.71% | 77.33% | 50.24% |
| L1-DCache Miss Rate | 5.91% | 9.24% | 6.77% |
| LLC Cache Miss Rate | 56.98% | 59.64% | 27.90% |
| Execution Time (seconds) | 6.27 | 2.41 | 1.616 |
The overall cache misses have dropped to 50.24% for the open addressing compact variation, which is a ~50% improvement over open addressing. It also improves on the cache miss rate from the chaining implementation.
The more stark drop is in the LLC case where it has dropped from the high 50% range to 27.90%. That’s a change of over 50%! And, we can see this change reflected in the overall processing time of the load test too, which is a 1.5x improvement!
Conclusion
Being performant with a cache line isn’t just about using a contiguous data structure like a Vector over a non-contiguous data structure like a LinkedList. It matters far more how many elements you can fit into a cache line and how many pointer chases you go through to get to the actual data.
In the case of Strings, it seems we are always doomed to an additional pointer chase which is why u64 as keys is more cache performant. The best you could do here is to inline smaller strings onto the stack with something like smol_str, but this only works for strings upto 23 bytes long.
Thank you to Debasish Ghosh for reviewing a draft of this post.